Forum Replies Created
Check out all your contributions and responses across the community.
-
AuthorPosts
-
 Keymaster
Yes sir, this is a very common confusion because the Target and Stop Loss settings provide multiple methods to manage exits.
Let’s understand them one by one.
1. LTP Based
In LTP mode, you directly enter a price value.
When the Last Traded Price (LTP) reaches the value you have configured, AlgoDelta will automatically square off the position.
Example:
-Target LTP = 250
When the price reaches 250, the position will be exited.
-Stop Loss LTP = 200
When the price falls to 200, the position will be exited.

2. Candle Based
In Candle mode, two fields will appear:
-Timeframe
-Value
You can select a timeframe such as 1 Minute, 3 Minute, 5 Minute, 10 Minute, 15 Minute, etc.
AlgoDelta checks the candle close price of the selected timeframe.
Example:
-Timeframe = 1 Minute
-Stop Loss Value = 70
If a 1-minute candle closes at or below 70, the position will be exited.
Similarly, if you configure a Candle-based Target, the position will be exited when the candle close reaches the target value.

3. Percentage Based
In Percentage mode, you enter a percentage value instead of a price.
The Target or Stop Loss is calculated based on the entry price of the position.
Example:
-Stop Loss = 5%
If the position moves 5% against your entry price, the position will be exited.
-Target = 10%
If the position moves 10% in your favour, the position will be exited.

4.Points Based
In Points mode, you enter the number of points from the entry price.
Example:
-Stop Loss = 50 Points
If the price moves 50 points against your entry, the position will be exited.
-Target = 100 Points
If the price moves 100 points in your favour, the position will be exited.

So, in simple terms:
-LTP → Exit at an exact price.
-Candle → Exit based on candle closing price.
-Percentage → Exit based on percentage movement from entry.
-Points → Exit based on point movement from entry.
You can choose whichever method best matches your trading style and risk management requirements.
KeymasterYes sir, definitely. You can manage an already open broker position using the Order Manager feature in AlgoDelta.
Just follow the steps below:
Step 1:
Go to the Order Manager page from the sidebar.
If you don’t see the Order Manager option, first enable it from the Dashboard.

Step 2:
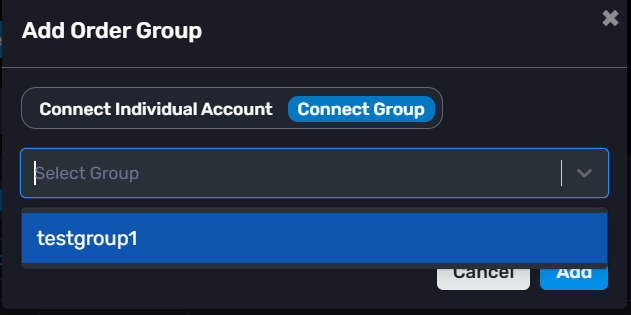
Click on “+ Add Order Group”.

You can select either an individual account or a group, depending on where the position is open.
Then click on “Add”.

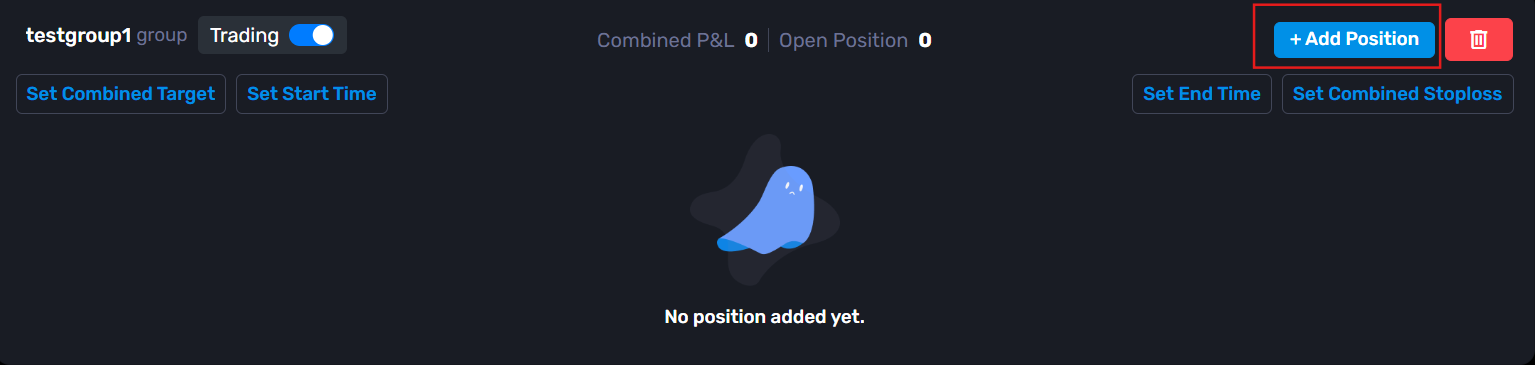
Step 3:
You will see the Order Group below and click on “+ Add Position”.

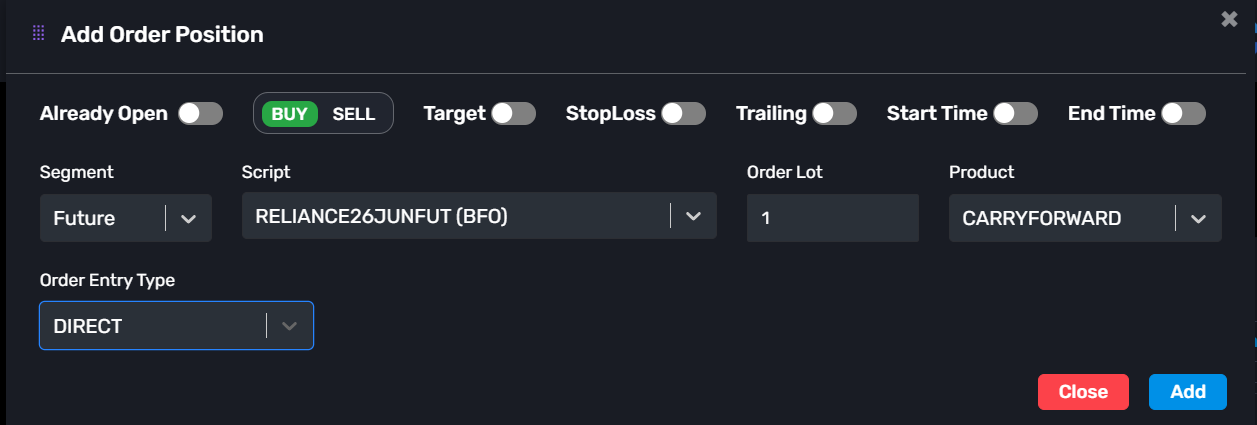
Now configure the same position that is already open in your broker account.
The important thing is that the script, quantity, transaction type, and product should match your existing position.
Example image below:
Note: if the order is already open then you have to enable compulsory already open enable.

You can also configure additional options such as:
-Trailing Stop Loss
-Start Time
-End Time
After completing the configuration, click on “Add”.
That’s it.

AlgoDelta will now start monitoring and managing that existing position. Whenever the configured Target, Stop Loss, or Trailing Stop Loss is triggered, AlgoDelta will automatically square off the position.
So even if the trade was opened directly from your broker account, you can still use AlgoDelta to manage exits and risk management without placing a new order.
KeymasterYes sir, you can definitely do that with AlgoDelta.
For this, you can use either the Custom Bridge or the JSON Bridge.
For simplicity, let’s take the example of the Custom Bridge.
Step 1:
Go to the Custom Bridge page and create a Custom Bridge if you don’t already have one.
Step 2:
Configure the Upside Execution.
Example:
Exchange: NFO
Symbol: NIFTY
Product: Carry Forward
Script Type: Future
Order Lot: 1
Expiry Gap: 0
Transaction Type: Buy
Exit on Opposite Signal: Enable (Optional)
Click on Submit.

Step 3:
Similarly, configure the Downside Execution according to your requirements.

Step 4:
Copy the webhook URL.
You can find it using the yellow copy icon either from the Custom Bridge listing page or from inside the Custom Bridge itself.

Step 5:
Now open MT5 and whitelist the webhook URL.
Go to:
Tools -> Options -> Expert Advisors

Enable:
“Allow WebRequest for listed URL”
Click on the green “+” button and paste your webhook URL.
Click OK.

Note: This setup works through Expert Advisors because only EAs can make WebRequest calls.
Step 6:
Open your strategy code in MetaEditor and add the following function:
string StrategyUrl = "Webhook URL"; void SendSignalToWebhook1(string signal_side) { Print(signal_side); string headers = "Content-Type: text/plain\r\n"; char post[], result[]; int timeout = 20000; StringToCharArray(signal_side, post, 0, StringLen(signal_side)); ResetLastError(); int res = WebRequest( "POST", StrategyUrl, headers, timeout, post, result, headers ); if (res == -1) { Print("WebRequest Error: ", GetLastError()); } else { Print("Webhook Response: ", CharArrayToString(result)); } }Step 7:
Now call this function whenever your strategy generates a signal.
For Upside Execution:
SendSignalToWebhook1(“UP”);
For Downside Execution:
SendSignalToWebhook1(“DOWN”);
Example Buy Condition:
bool breakoutBuy = ema1 > ema2; if(breakoutBuy) { SendSignalToWebhook1("UP"); trade.Buy( LotSize, _Symbol, 0, S1, R1 + (R1 - P), "Breakout Buy" ); Print("BUY BREAKOUT"); }Example Sell Condition:
bool breakoutSell = ema2 > ema1; if(breakoutSell) { SendSignalToWebhook1("DOWN"); trade.Sell( LotSize, _Symbol, 0, R1, S1 - (P - S1), "Breakout Sell" ); Print("SELL BREAKOUT"); }That’s it.
Now whenever your MT5 strategy sends: “UP” the configured Upside Execution in AlgoDelta will be triggered. “DOWN” the configured Downside Execution in AlgoDelta will be triggered.
So, your MT5 strategy can continue generating signals, while AlgoDelta handles the actual order execution according to the configuration you’ve set in the bridge.
KeymasterYes sir, you can definitely do that with the Custom Bridge.
Just follow the steps below.
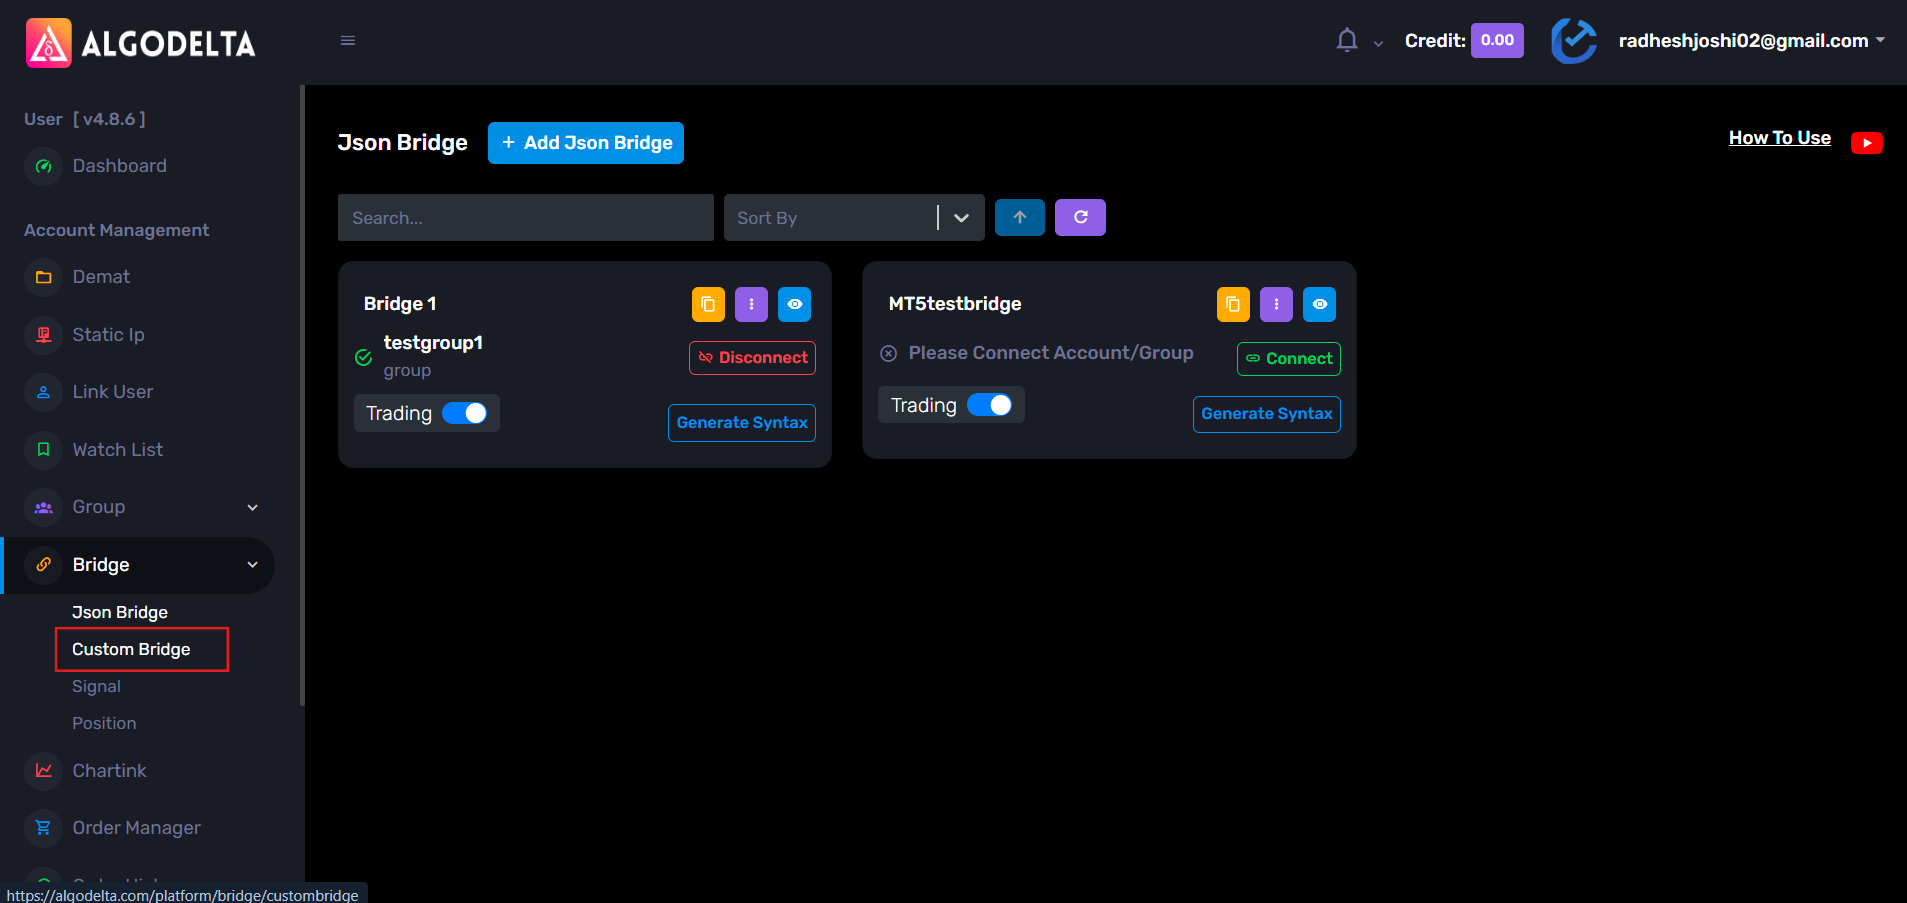
Step 1:
Go to: Bridge -> Custom Bridge
Create and configure a Custom Bridge if you don’t already have one.
Step 2:
Configure your Upside Execution and Downside Execution according to your requirements.
For example:
Upside Execution:
Exchange: NFO
Script Type: Future
Symbol: NIFTY
Transaction Type: Buy
Expiry Gap: 0
Order Lot: 1
Product: Carry Forward
Similarly, configure the Downside Execution as required.

Step 3:
Copy the webhook URL using the yellow copy icon available on the Custom Bridge page.

Step 4:
Now open Ami Broker and go to the strategy code where your Buy and Sell conditions are written.
Usually this will be inside the Formula Editor (AFL).
Step 5:
Add the following function to send signals to the AlgoDelta webhook:
webhookURL = "URL"; function placeBridgeOrder(webhookURL, trade_signal) { curlCmd = "curl --location ''' + webhookURL + ''' " + "--header ''Content-Type: text/plain'' " + "--data ''' + trade_signal + '''"; _TRACE(curlCmd); ShellExecute( "cmd.exe", "/c " + curlCmd, "", 0 ); }Step 6:
Replace the URL value with your Custom Bridge webhook URL.
Eg: https://apiv4.algodelta.com/api/v4/users/bridge/webhook/1709/AMITest
Step 7:
Now call the function wherever your Buy and Sell conditions become true.
Buy Signal Example:
if(LastValue(Buy)) { placeBridgeOrder(webhookURL, "UP"); _TRACE("UP"); }Sell Signal Example:
if(LastValue(Sell)) { placeBridgeOrder(webhookURL, "DOWN"); _TRACE("DOWN"); }That’s it.
Now whenever your Ami Broker strategy generates a Buy signal, it will send the message “UP” to AlgoDelta through the webhook and the Upside Execution configured in your Custom Bridge will be executed.
Similarly, whenever a Sell signal is generated, it will send the message “DOWN” and the Downside Execution configured in your bridge will be executed automatically.
So, this is how you can connect Ami Broker with AlgoDelta’s Custom Bridge and automate your trade execution.
KeymasterYes sir, configuring a Custom Bridge is quite simple once you understand the fields.
After creating the Custom Bridge, open it and click on the “+ Add” button.
Then configure the execution details according to the trade you want to place:
-Exchange: NFO, BFO, NSE, MCX, etc.
-Symbol: NIFTY, BANKNIFTY, RELIANCE, etc.
-Product: Carry Forward, Intraday, Delivery, etc.
-Script Type: Equity, Future, or Option
If you select Option, configure it like the example shown below:

If you select Future, configure it like the example shown below:

If you select Equity, configure it like the example shown below:

After completing the configuration, click on the “Submit” button.
This will configure your Upside Execution.
Now repeat the same process for the Downside Execution according to the trade you want to execute when a DOWN signal is received.
For example:
-Upside Execution → Buy NIFTY Future
-Downside Execution → Sell NIFTY Future
or
-Upside Execution → Buy Call Option
-Downside Execution → Buy Put Option
Once both sides are configured, your Custom Bridge is ready.
Now whenever the bridge receives an “UP” signal, the Upside Execution will be triggered, and whenever it receives a “DOWN” signal, the Downside Execution will be triggered automatically.
KeymasterYes sir, that’s a very valid question.
The tricky part is that Options trading works a little differently compared to Futures and Stocks when using the JSON Bridge.
Because Call and Put options are different instruments, we cannot always achieve this behavior by simply enabling a standard “Exit on Opposite” setting like we do in Futures.
To implement this properly, a custom JSON syntax is usually required.
That syntax needs to handle:
-Squaring off the existing option position first
-Identifying the correct opposite-side option contract
-Executing the new order after the existing position is closed
Because of this additional logic, the syntax generally needs to be configured manually based on your exact requirement.
So if you want a setup like:
-Buy Signal → Exit existing Put → Buy Call
-Sell Signal → Exit existing Call → Buy Put
then we recommend contacting the support team.
They can guide you with the correct syntax configuration and, if required, forward the requirement to the technical team for assistance.
Since the implementation depends on your trading setup and option selection logic, the support team will be able to provide the most accurate solution for your specific use case.
KeymasterYes sir, you can definitely do that with AlgoDelta.
Just follow the steps below.
Step 1:
Go to:
Bridge -> JSON Bridge
Create a JSON Bridge if you don’t already have one.
Step 2:
Click on “Generate Syntax”.
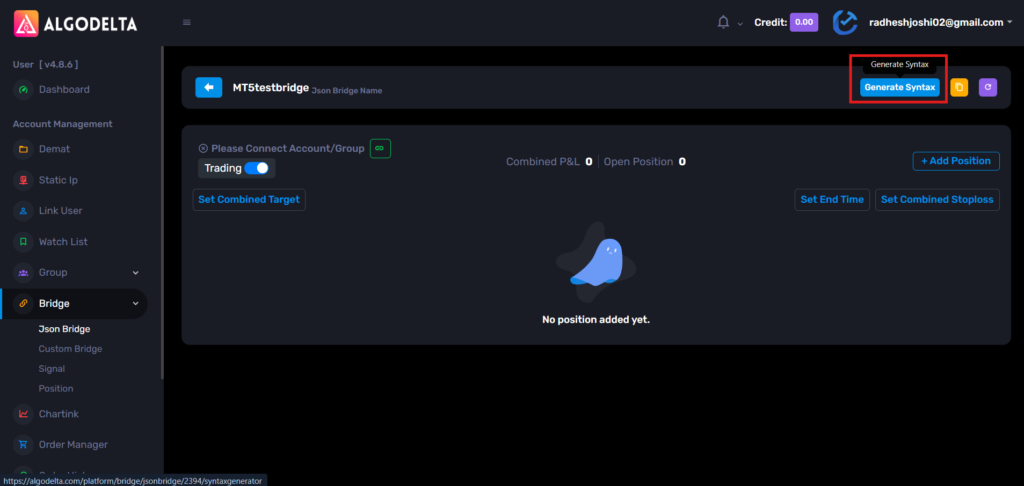
Now configure your Buy side order.
Example:
Script Type : Future
Script : NIFTY-N (NFO)
Expiry Gap : 0
Expiry Type : Monthly
Product : Carry Forward
Quantity : 1
Transaction Type : BUY
If you want the position to be closed automatically when an opposite signal comes, enable:
Exit On Opposite
You can also configure optional settings like:
-Rollover
-Target
-Stop Loss
-Trailing Stop Loss

Step 3:
Copy the generated syntax from the right side and save it somewhere.
This will be your BUY syntax.
Step 4:
Now generate another syntax for the SELL side.
Keep all settings the same except:
Transaction Type: SELL
Again, copy and save the generated syntax.
This will be your SELL syntax.

Step 5:
Copy the webhook URL from the JSON Bridge.

Step 6:
Now open MT5 and whitelist the webhook URL.
Go to:
Tools -> Options -> Expert Advisors

Enable:
Allow WebRequest for listed URL
Click on the green “+” button and paste the webhook URL.
Click OK.
Now the webhook URL is registered successfully.

Step 7:
Open your MT5 strategy code in MetaEditor and use the following function:
input string StrategyUrl = "URL"; void SendSignalToWebhook1(string signal_side) { string longMessage = "{\"type\":\"strategy_order\",\"exit_on_opposite\":true,\"is_tgt\":false,\"is_sl\":false,\"is_trail_set\":false,\"position_size\":\"{{strategy.position_size}}\",\"transaction_type\":\"BUY\",\"script_type\":\"FUT\",\"is_rollover\":false,\"script\":\"NIFTY-N\",\"expiry_gap\":0,\"expiry_type\":\"monthly\",\"product\":\"CARRYFORWARD\",\"quantity\":1}"; string shortMessage = "{\"type\":\"strategy_order\",\"exit_on_opposite\":true,\"is_tgt\":false,\"is_sl\":false,\"is_trail_set\":false,\"position_size\":\"{{strategy.position_size}}\",\"transaction_type\":\"SELL\",\"script_type\":\"FUT\",\"is_rollover\":false,\"script\":\"NIFTY-N\",\"expiry_gap\":0,\"expiry_type\":\"monthly\",\"product\":\"CARRYFORWARD\",\"quantity\":1}"; string payload = ""; if(signal_side == "UP") payload = longMessage; else if(signal_side == "DOWN") payload = shortMessage; else return; string headers = "Content-Type: application/json\r\n"; char post[], result[]; int timeout = 20000; StringToCharArray(payload, post, 0, StringLen(payload)); ArrayResize(post, StringLen(payload)); ResetLastError(); int res = WebRequest( "POST",StrategyUrl,headers,timeout,post,result,headers); if(res == -1) Print("WebRequest Error: ", GetLastError()); else Print("Webhook Response: ", CharArrayToString(result)); }Step 8:
Replace:
-StrategyUrl with your JSON Bridge webhook URL
-longMessage with your generated BUY syntax
-shortMessage with your generated SELL syntax
Step 9:
Now call the function wherever your Buy or Sell condition becomes true.
Example Buy Signal:
if(buySignal && posType != POSITION_TYPE_BUY) { SendSignalToWebhook1("UP"); // Existing Buy Logic }Example Sell Signal:
if(sellSignal && posType != POSITION_TYPE_SELL) { SendSignalToWebhook1("DOWN"); // Existing Sell Logic }That’s it.
Now whenever your MT5 strategy generates a Buy signal, the BUY JSON syntax will be sent to AlgoDelta and the configured Futures order will be executed.
Similarly, whenever your strategy generates a Sell signal, the SELL JSON syntax will be sent, and the corresponding Futures order will be executed automatically through the JSON Bridge.
KeymasterYes sir, creating a JSON Bridge is very simple and only takes a few clicks.
Step 1:
Login to AlgoDelta.
From the left sidebar, go to:
Bridge -> JSON Bridge

If you don’t see the JSON Bridge option, go to the Dashboard and enable the JSON Bridge feature first.

Step 2:
Open the JSON Bridge page and click on:
“+ Add JSON Bridge”

Step 3:
Enter a name for your bridge.
Example:
JSON Bridge Name : Bridge 1
Then click on the “Add” button.
That’s it. Your JSON Bridge has been created successfully.

After creating the bridge, you can:
-Generate JSON syntax for your orders


-Copy the webhook URL
-Connect it with TradingView or any platform that supports webhook-based automation
-Test your syntax using the Simulation feature before going live
So the overall process is:
-Create the JSON Bridge
-Generate the required syntax
-Copy the webhook URL
-Connect it to your signal source
-Start automating your trades
Once the bridge is created, you can generate different types of order syntax such as Stocks, Futures, Options, Multi-leg orders, and many other supported order types based on your requirements.
KeymasterYes sir, creating a Custom Bridge is very simple and only takes a few clicks.
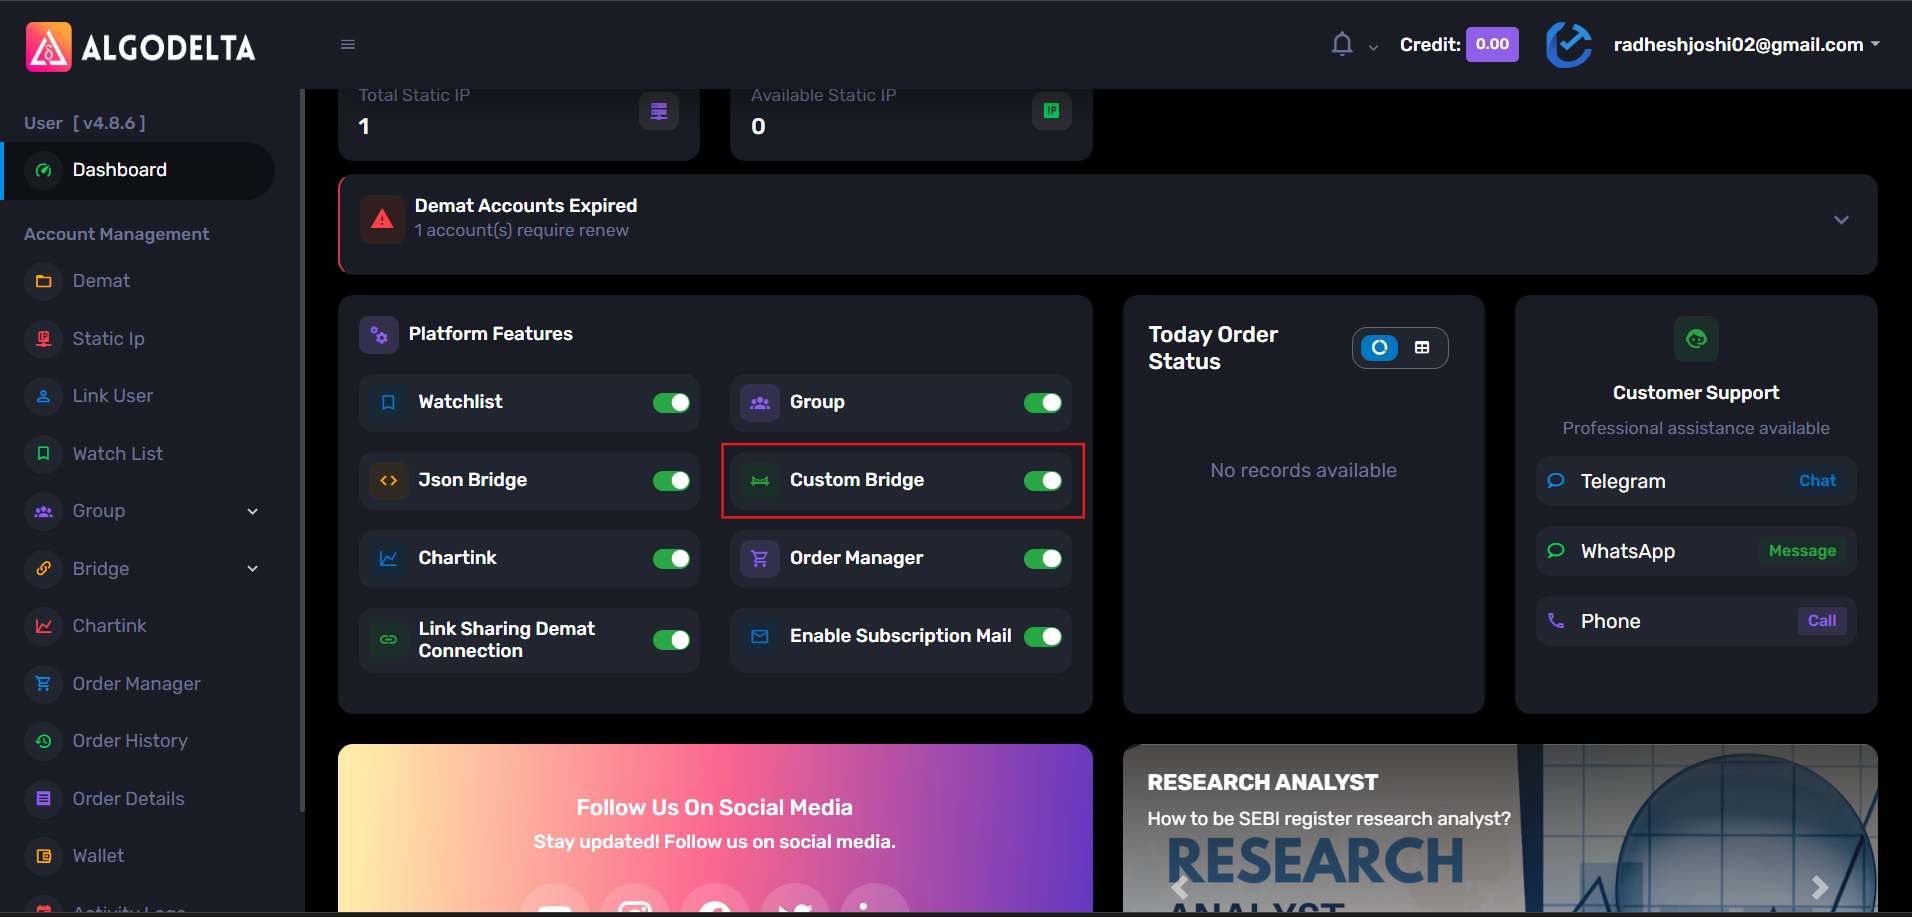
Step 1:
Go to the AlgoDelta platform.
From the left sidebar, navigate to Bridge → Custom Bridge.
From there, you can create a new Custom Bridge and configure it according to your trading requirements.
If you do not see the Custom Bridge option, go to the Dashboard and enable the Custom Bridge feature first.
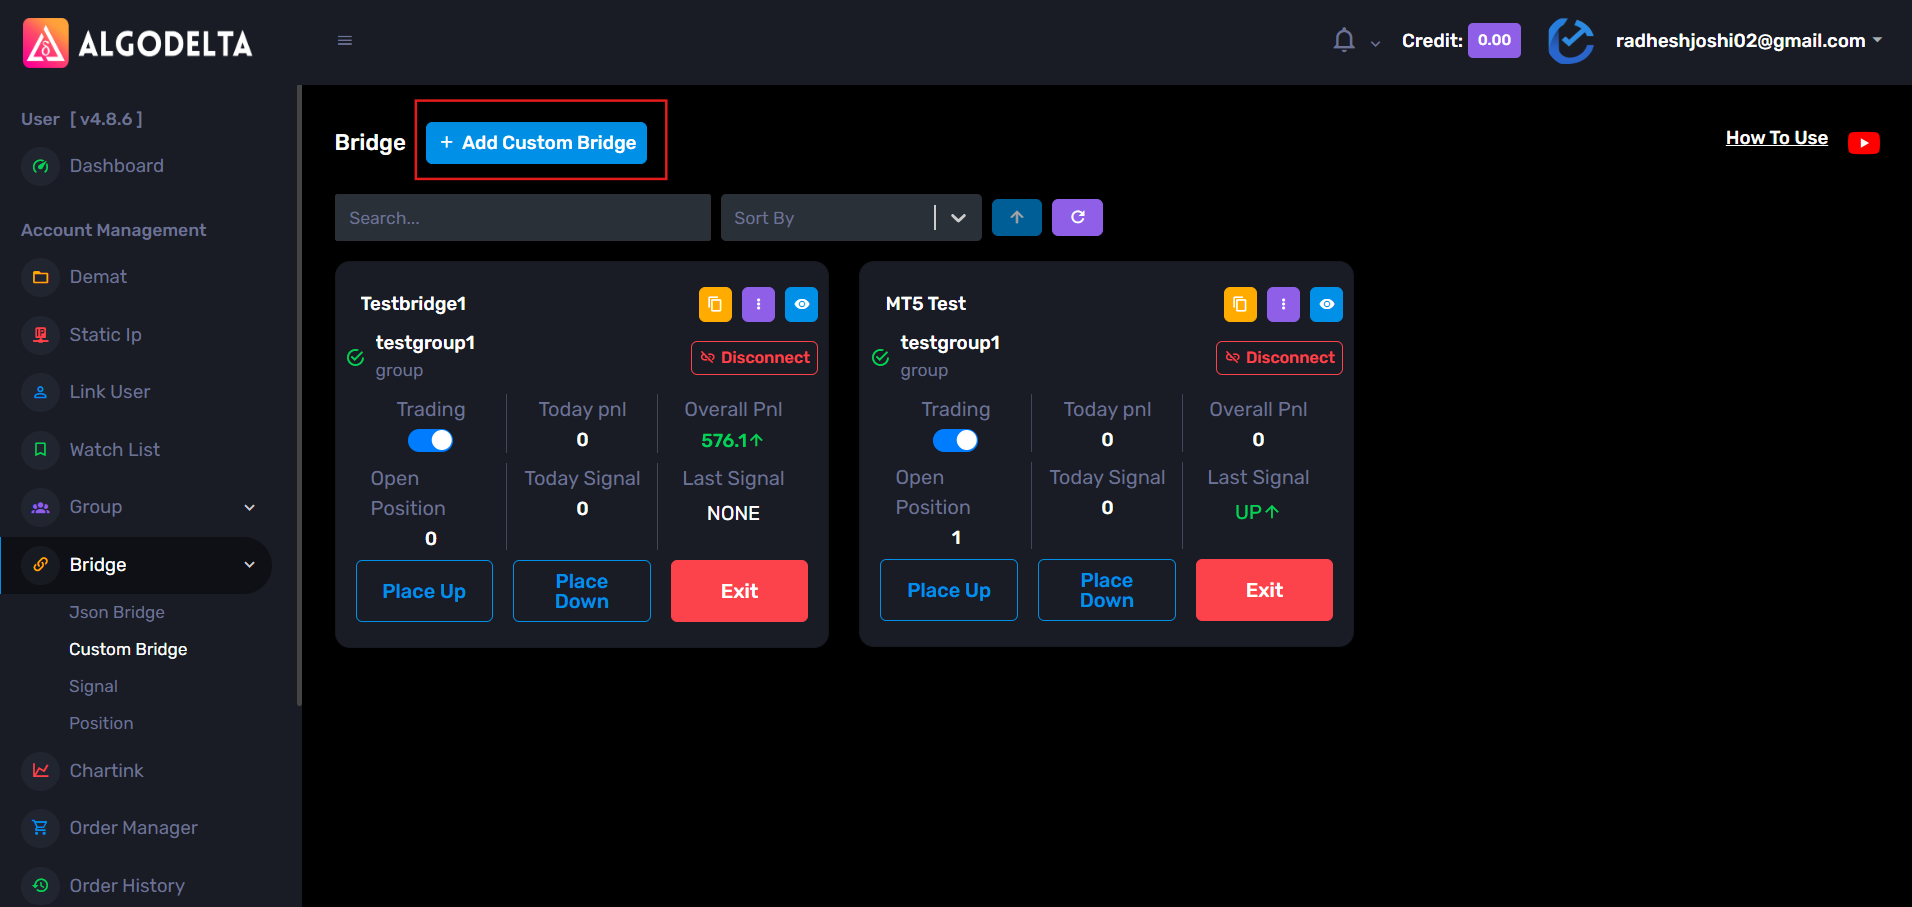
Step 2: Open the Custom Bridge page and click on : “+ Add Custom Bridge”
Step 3:
A popup window will appear.
Enter the following details:
Bridge Name: Enter any name of your choice for the bridge.
Bridge Key: Enter any alphanumeric key of your choice (for example: Test123).
After entering the required details, click on the Add button to create the Custom Bridge.
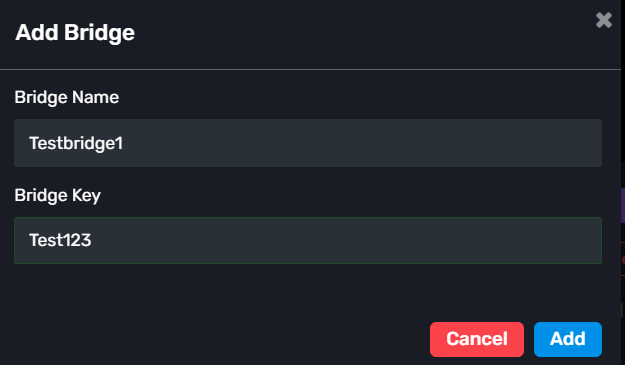
That’s it. Your Custom Bridge is now created.
After creating the bridge, you can:
- Configure the Up Side Execution
- Configure the Down Side Execution
- Copy the webhook URL using the yellow copy icon
Once the webhook is copied, you can connect the Custom Bridge with TradingView, MT5, or any platform that supports webhook-based automation.
So the setup is basically:
- Create the bridge
- Configure the execution settings
- Copy the webhook
- Connect it to your signal source
And you’re ready to automate your trades.
KeymasterYes, absolutely sir.
For this use case, you should use the Order Manager feature.
Let’s take an example with two trades:
– Reliance Future
-Adani Power FutureStep 1 : Open Order Manager and click: “+ Add Order Group”
Select your group from the dropdown and create the first order group.
If required, create another order Manager Group in the same way.
Step 2 : Inside the order manager group, click: “+ Add Position”
Step 3 : Configure the first position.
Example:
-Already Open: Disable
-Transaction Type: Buy
-Segment: Future
-Script: RELIANCE26JUNFUT
-Order Lot: 1
-Product: Carry Forward
-Order Entry Type: Direct
-> You can also configure:
-Target
-Stop Loss
-Trailing Stop Loss
-Start Time
-End TimeThen click Add.
Step 4 :
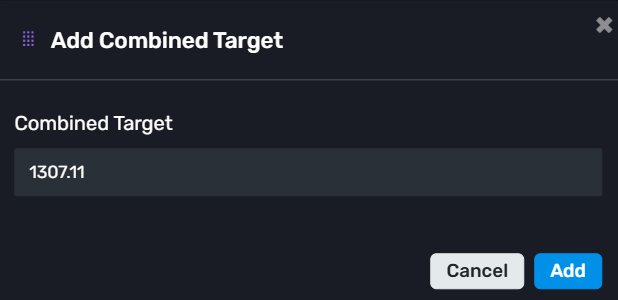
Now configure the combined risk management for this group.
Click: “Set Combined Target”
Enter your target value and save.
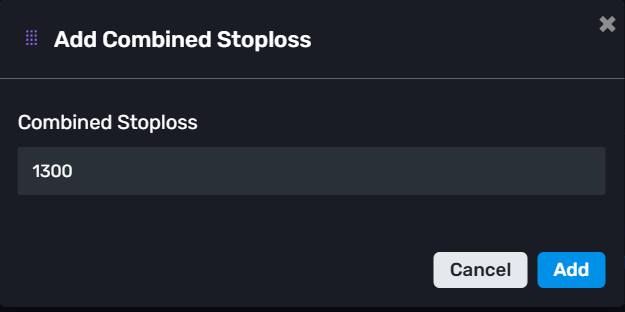
Similarly, click: “Combined Stop Loss”
Enter the stop loss value and save.
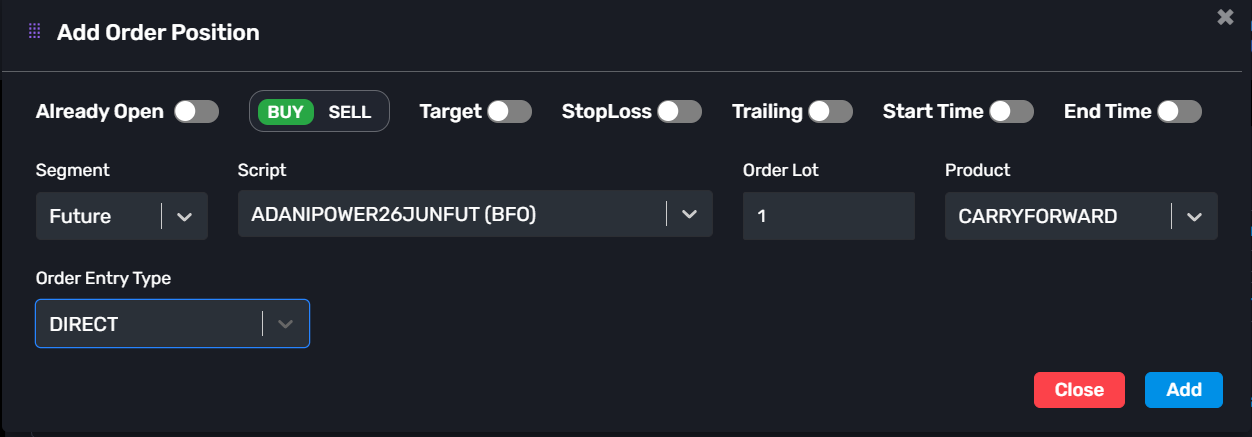
Step 5 :
Now create another position on another order manager group for the second trade.
Example:
-Already Open: Disable
-Transaction Type: Buy
-Segment: Future
-Script: ADANIPOWER26JUNFUT
-Order Lot: 1
-Product: Carry Forward
-Order Entry Type: Direct
-> Again, configure the optional thing if you want :
-Target
-Stop Loss
-Trailing Stop Loss
-Start Time
-End TimeThen click Add.
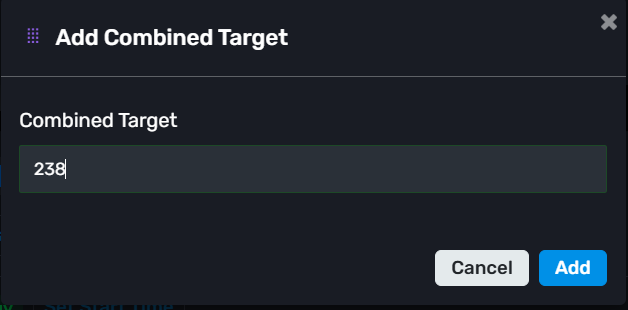
Step 6 :
Set the Combined Target and Combined Stop Loss for this group as well, exactly like you did for the first one.
So now both order groups will work independently.
For example:
Reliance group can have its own capital, timing, SL, and Target
Adani Power group can have completely different capital, timing, SL, and TargetAt the same time, orders will be executed across all child accounts connected to that group.
-> Note: Orders will only be placed in the child accounts that are linked to the main group, not on the master account. This allows you to manage different strategies and risk settings separately while still using the same AlgoDelta setup.
KeymasterYes sir, AlgoDelta provides a Watchlist feature similar to other brokers.
Just follow the steps below:
Step 1:
Go to the Dashboard page.Step 2:
Check the sidebar menu on the left side.Step 3:
If you do not see the Watchlist option, the Watchlist toggle may be disabled.Step 4:
Enable the Watchlist toggle from your Dashboard settings.Step 5:
Once enabled, the Watchlist option will appear in the sidebar along with options like Bridge, Profile, and History.Step 6:
Open the Watchlist page and click on the “Add Script” button.Step 7:
Search for the stock or instrument you want to track and add it to your watchlist.That’s it. Your watchlist will be created successfully, and you can add multiple stocks or instruments to monitor them easily.
KeymasterThis is a very common confusion while using groups for the first time.
The behavior depends on how the trade is being triggered.
If you are using:
-JSON Bridge
-Custom Bridge
-Order Manager
and you select a group there, then the orders will be placed only in the Child accounts connected to that group.
The Master account is not used for execution in this case.
-> So if you’re using JSON Bridge or Order Manager and selecting a group, don’t worry if you don’t see orders in the Master account. That is the expected behavior, and the execution will happen only in the Child accounts linked to that group.
KeymasterYes sir, you can definitely do that.
After creating your ChartInk Group, you will find an option called “Place Listed Stocks”.
Just enable this option and add the stocks that you want to trade using the “+ Add Stock” button.
After that, whenever a signal comes from ChartInk, AlgoDelta will first check your configured stock list.
-If a stock is present in both your configured list and the ChartInk scanner result, the order will be placed.
-If a stock comes from the ChartInk scanner but is not present in your configured list, the order will be ignored.
For example:
-Your configured stock list: RELIANCE, TCS
-Stocks received from ChartInk: RELIANCE, ADANIPOWER
In this case, the order will be placed only for RELIANCE because it is present in both lists.
So if you want full control over which stocks can be traded, simply enable the “Place Listed Stocks” option and maintain your own stock list.
KeymasterYes sir, AlgoDelta provides multiple ways to check why an order was rejected or cancelled.
The easiest way is through the Order Details page.
Step 1:
Open the Order Details page.
Step 2:
Select the date range for which you want to check the orders.
Step 3:
You will see all the orders placed during that period.
Step 4:
In the Status column, hover over the particular order status.
There you can see the detailed rejection or cancellation reason provided by the broker.
This can include reasons such as: Insufficient funds, RMS rejection, Quantity issues, Product mismatch, Exchange rejection, Any other broker-side error.
You can also check the same information from the Order History page.
Step 1:
Go to the Order History page.
Step 2:
Select the “Individual Orders” option above the table.
Step 3:
Choose the required date range.
Step 4:
Hover over the status of the order you want to inspect.
The detailed rejection reason will be displayed there as well.
So whenever you want to know why an order failed, the Order Details page is usually the quickest option, and the Order History page can also be used to view the same information.
KeymasterYes sir, this is a common question.
If a Static IP expires due to insufficient credits, then that same IP cannot be renewed again.
You will need to purchase a new Static IP from AlgoDelta.
After purchasing the new IP, you will also need to update and configure that IP again in your broker’s developer portal or API settings, just like you did during the initial setup.
Once the new IP is configured and whitelisted properly, your orders will start working normally again.
So in short:
-Expired IPs cannot be renewed.
-A new Static IP must be purchased.
-The new IP must be configured again with your broker.
-After that, order execution will continue normally.
-
AuthorPosts