
Forum Replies Created
Check out all your contributions and responses across the community.
-
AuthorPosts
-

When an order is rejected in the master account for any reason, but you still want to place that order in the child account, you can use this option.
Use case: When there are insufficient funds in the master account, but you still want to place the orders in the child accounts.
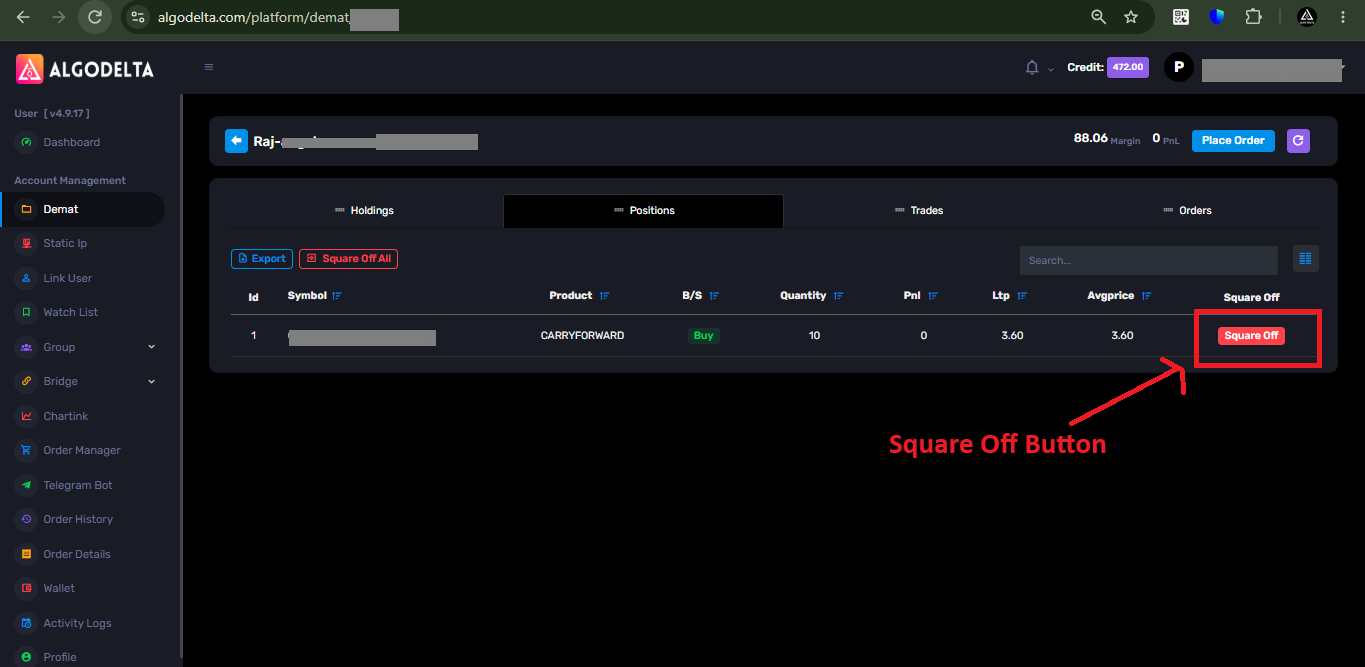
By following these simple steps, you can square off the positions of a specific account.
1 ) First, go to the “Demat” tab.
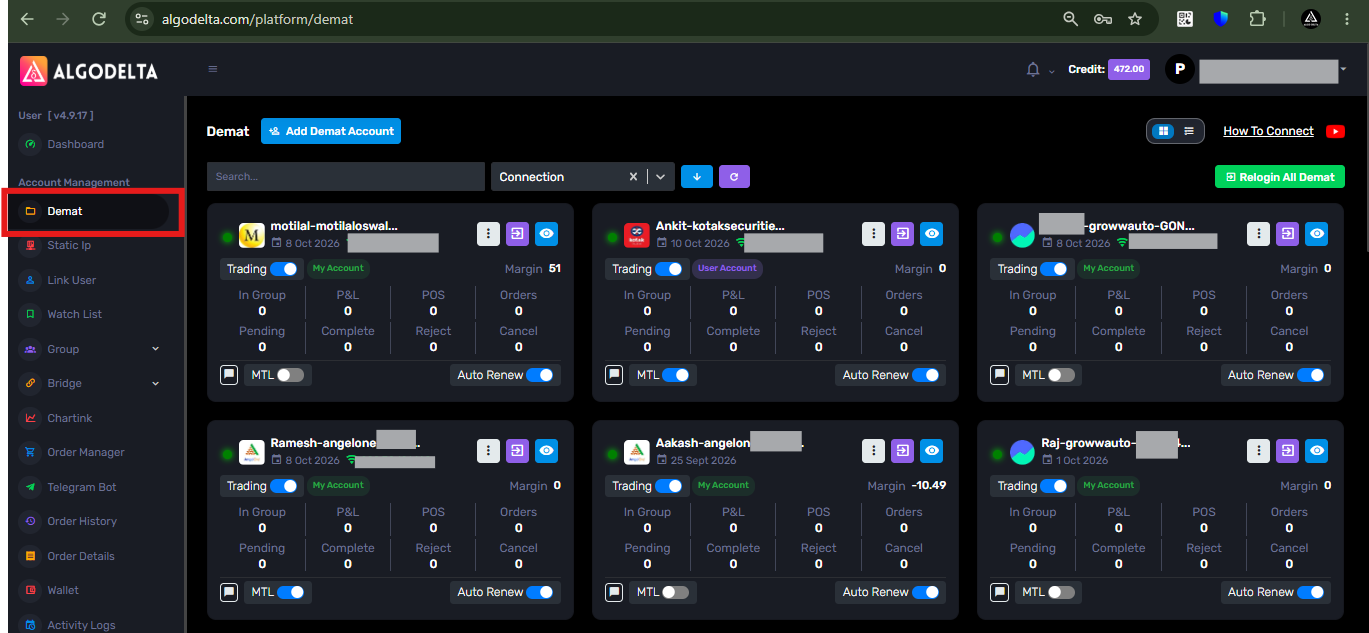
2 ) Then, in the search bar, enter your account name, such as “Ramesh,” “Suresh,” or “Ankit,” or enter the Client ID of that account.
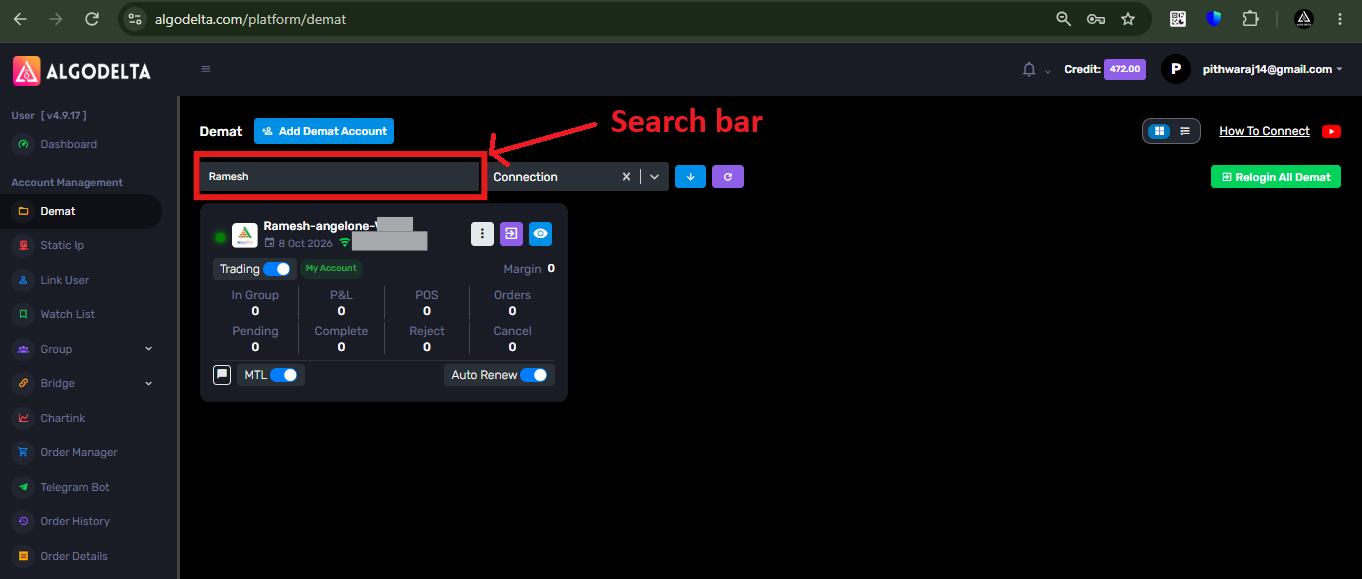
3 ) Then, click on the blue-colored eye button.
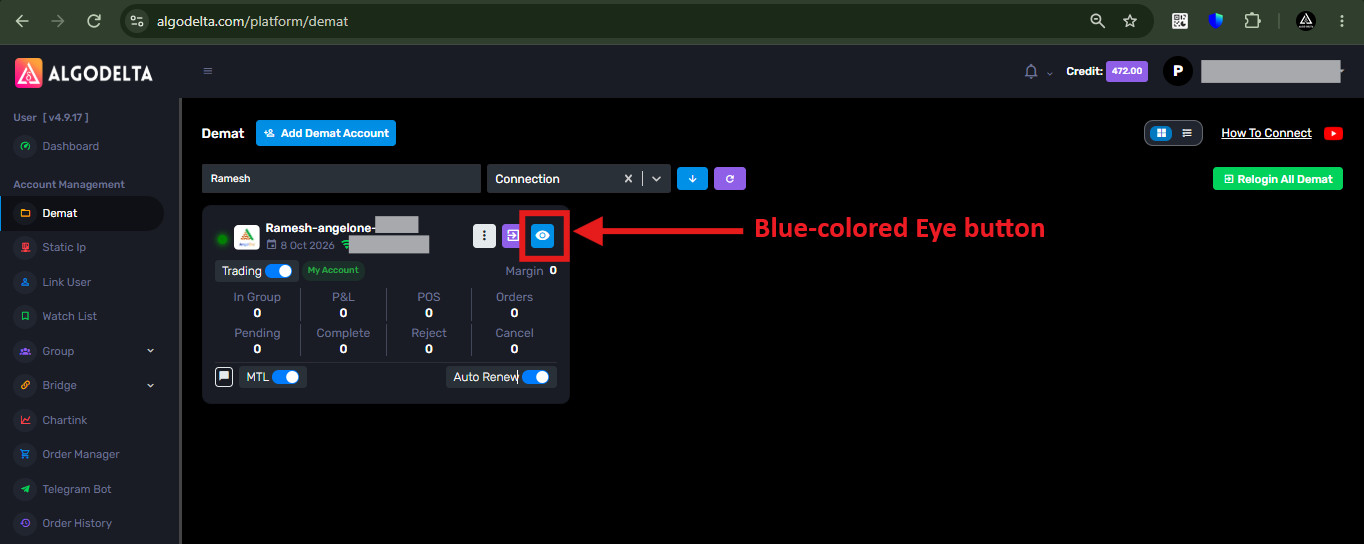
4 ) Then, click on the “Positions” tab.
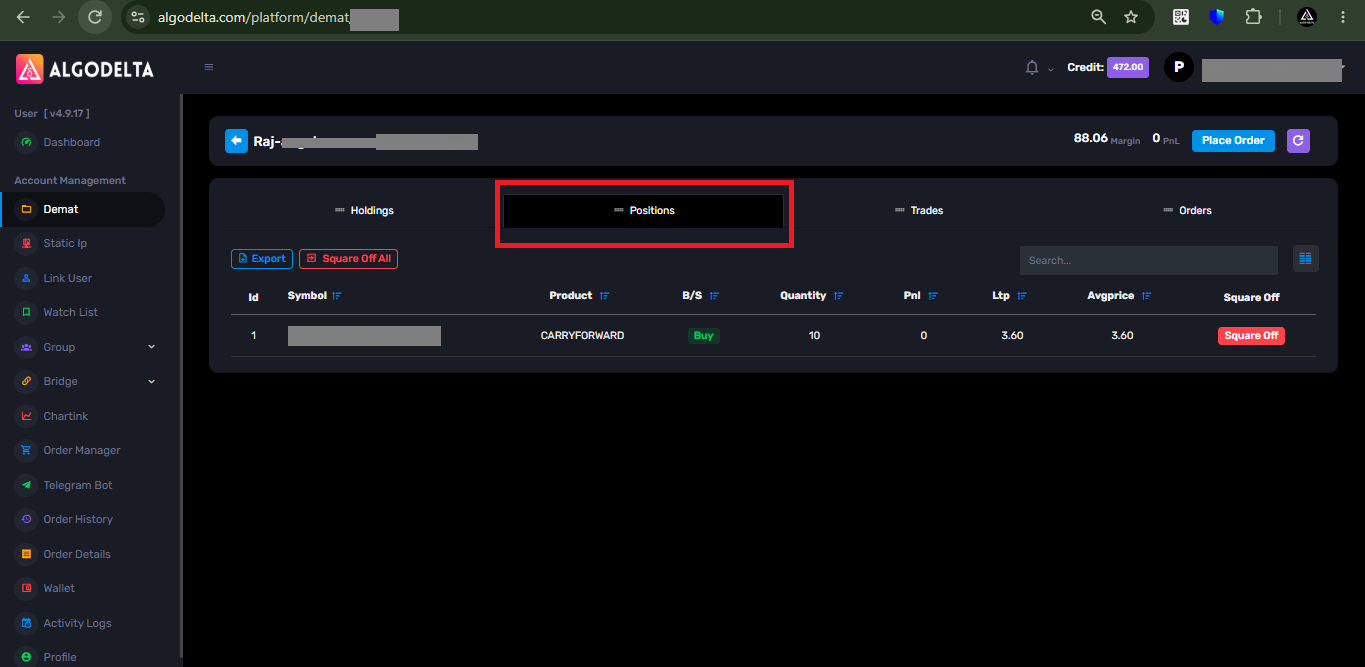
5 ) Then, go to the “Square Off” column and click the red-colored “Square Off” button for whichever position you want to square off.
If you want to update the PIN, password, or any other details of an account already added to AlgoDelta, follow the steps below.
1 ) First, go to the “Demat” tab.
2 ) Then, in the search bar, enter your account name, such as “Ramesh,” “Suresh,” or “Ankit,” or enter the Client ID of that account.
3 ) Then, click on the white three-dot button.
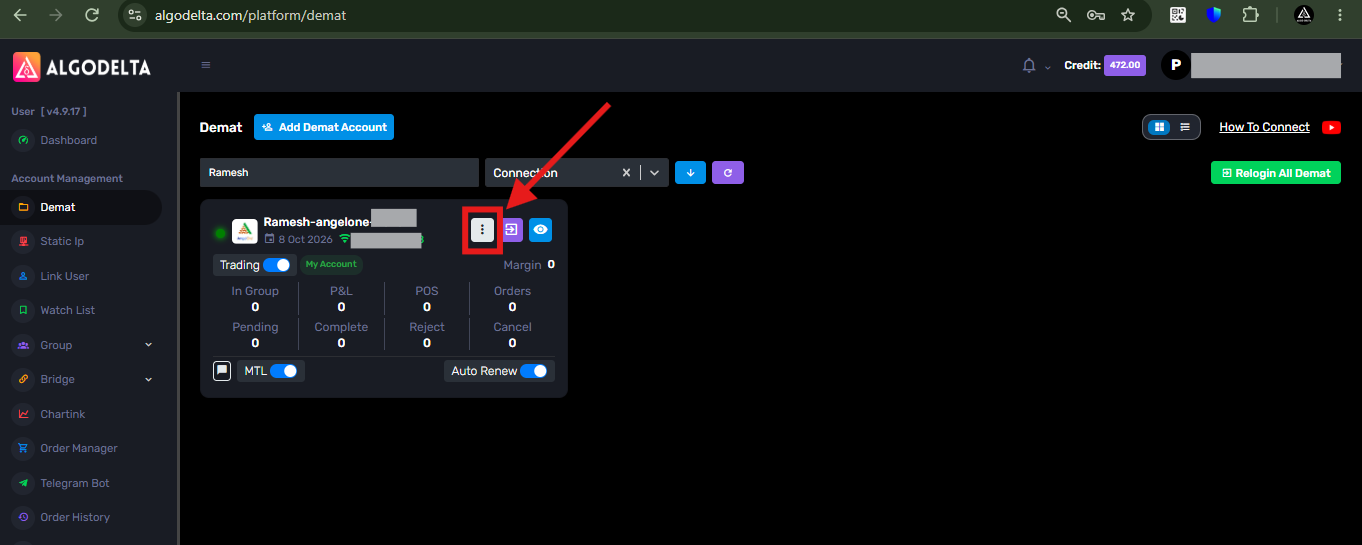
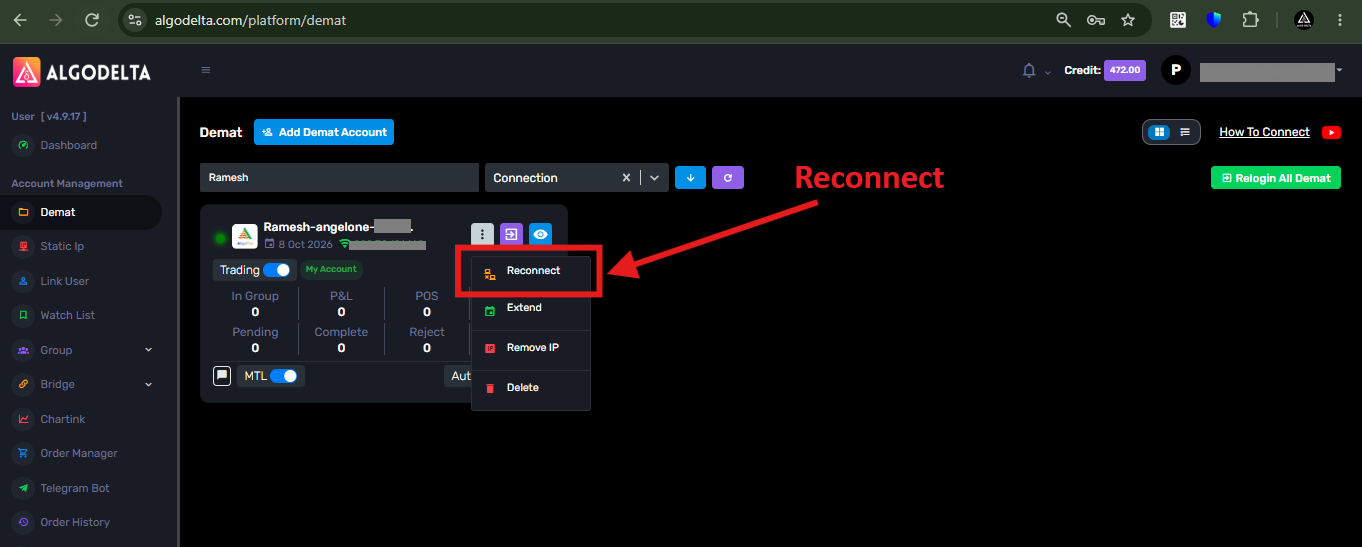
4 ) Then, click on the “Reconnect” option.
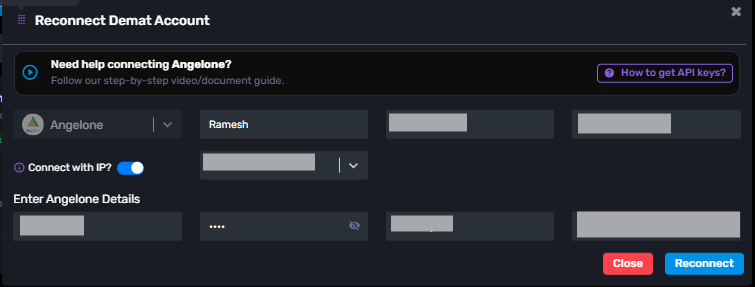
5 ) Now, you will see a pop-up like the one shown in the screenshot below. You can update the required details and then click the “Reconnect” button.
For any queries regarding your strategy, you can contact us at 83476 74727.
If you are using any of the following brokers:
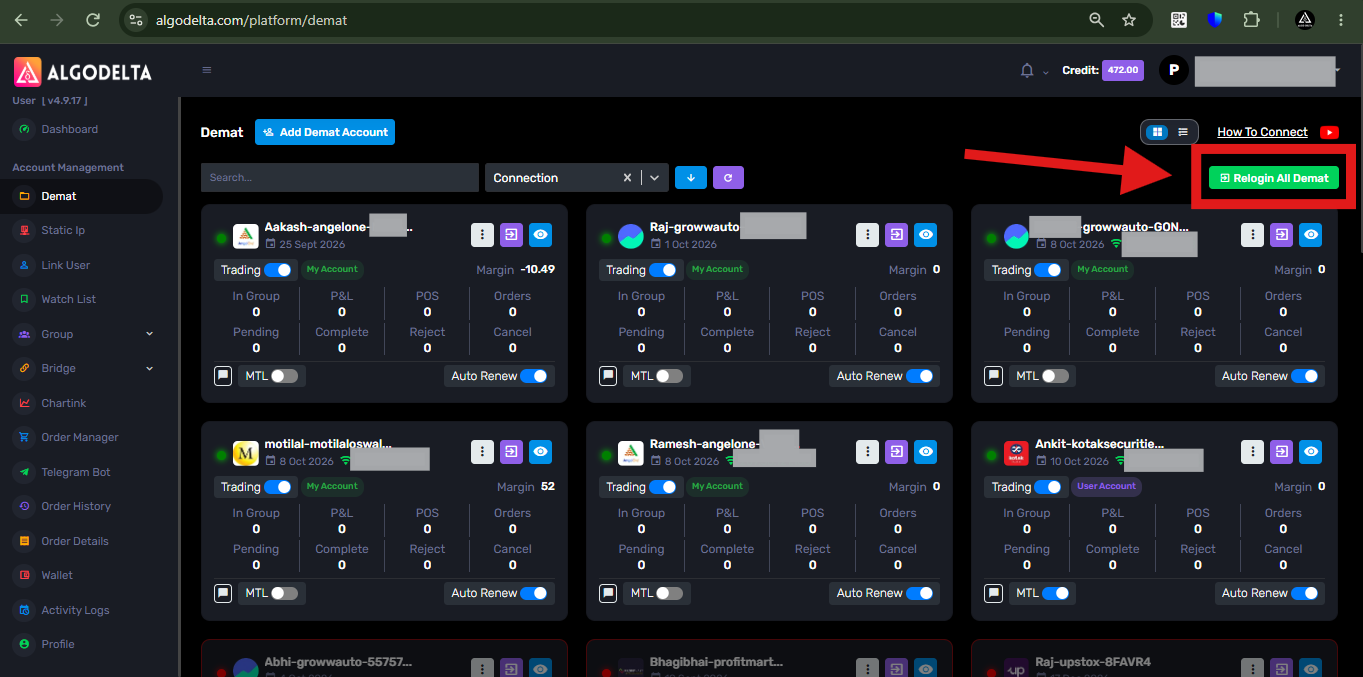
Angel One , IIFL New , Jainam – Normal , Kotak Securities ,Motilal – Normal , Zerodha (Without API) ,DefineEdge , Groww Auto , Enrich ,R Money, Trade Smart , Nirmal Bang ,
Rikhav ,Centrum, JM FinanceThen you need to click the green 🟩 “Relogin All Demat” button located at the top-right corner of the “Demat” tab in AlgoDelta to refresh the token.
————————————————————————————————————————————–
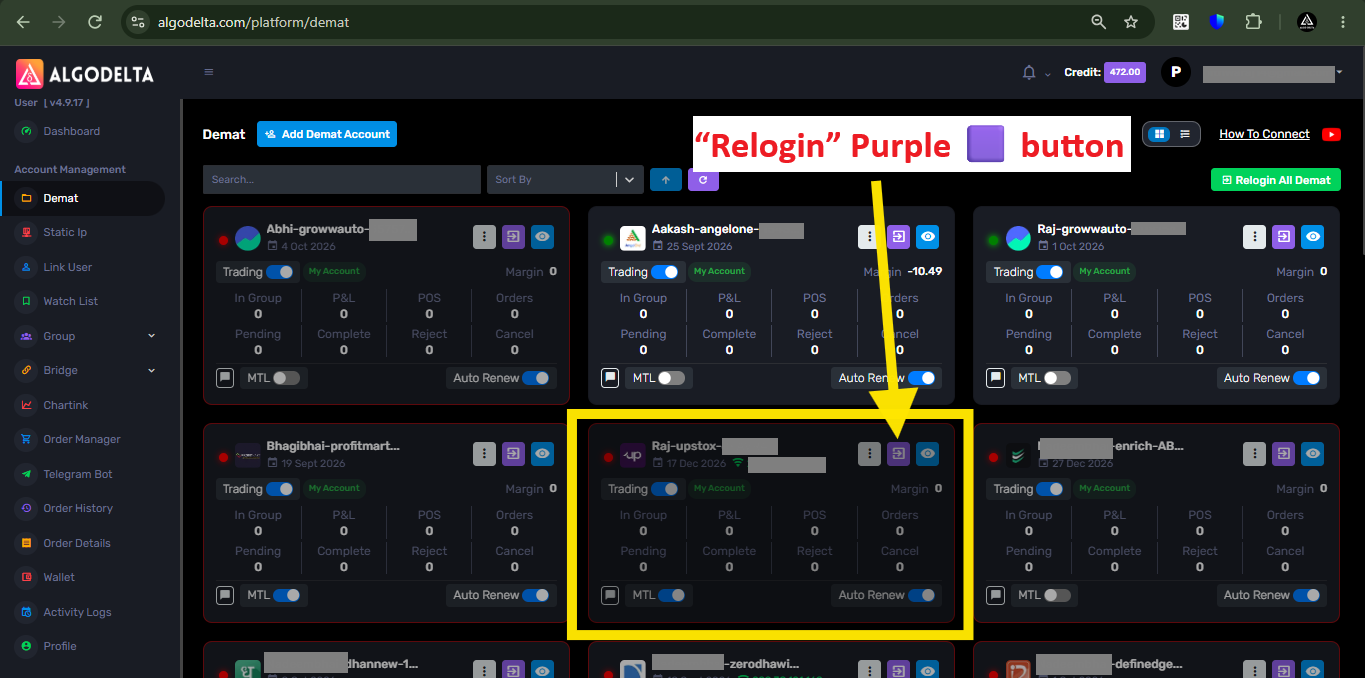
If you are using the “DhanNew” broker, click the purple 🟦 “Relogin” button on the “Demat” tab in AlgoDelta (the relogin purple 🟦 button on the account box) after 9:00 AM if it is showing red.
————————————————————————————————————————————–
If you are using Alice Blue, IIFL Market, Fyers, Upstox, Flattrade, Shoonya, Nuvama, Profit Mart, Zerodha (with API), Rupeezy (Astha Trade), Goodwill, Zebu, Jainam Lite, or PL Capital, first open your broker account in the same browser tab where AlgoDelta is logged in.Then, click the purple 🟦 “Relogin” button on the “Demat” tab in AlgoDelta (the relogin purple 🟦 button on the account box) to refresh the token.
For example, if I am using Upstox, I just need to log in to my Upstox broker account in the same browser tab where AlgoDelta is logged in.
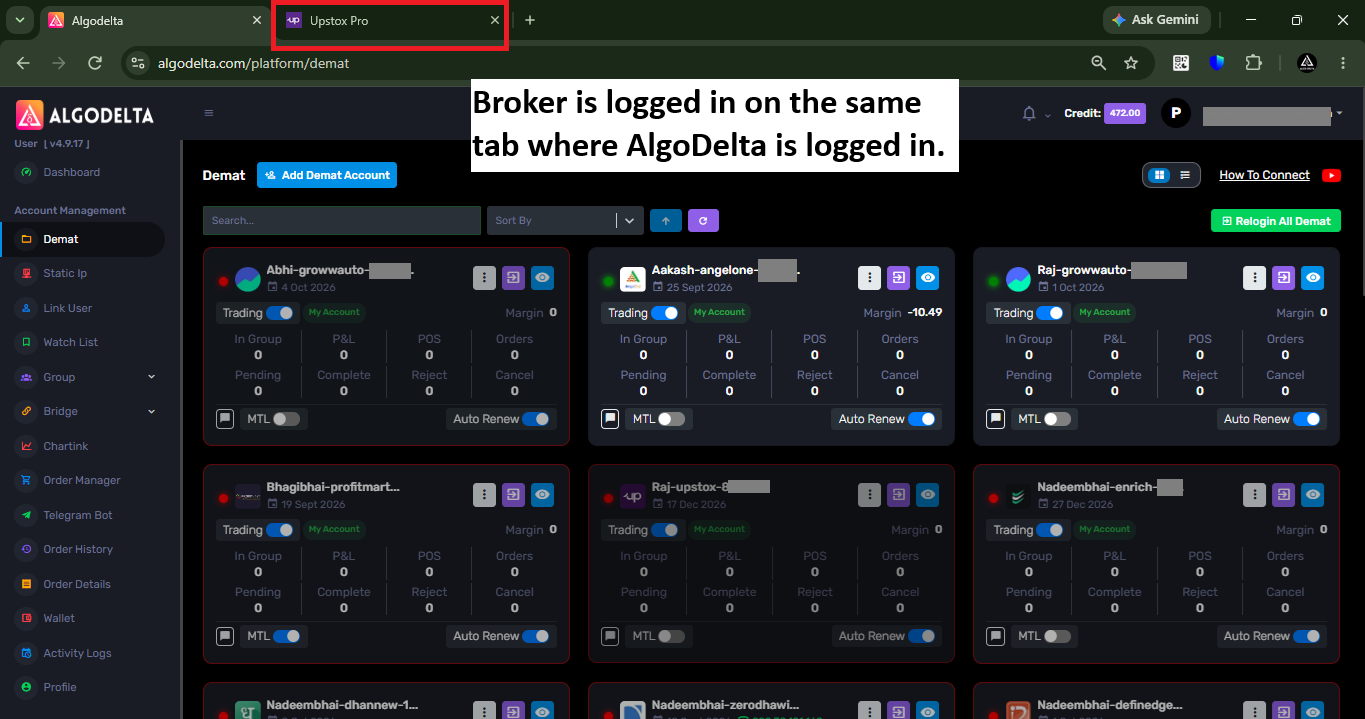
Then, I just need to click the purple “Relogin” button for that particular Upstox account in the “Demat” tab of AlgoDelta to refresh the token.
Let me explain.
1 ) To activate this feature, you need to enable the “Link Sharing Demat Connection” option from the Dashboard tab.
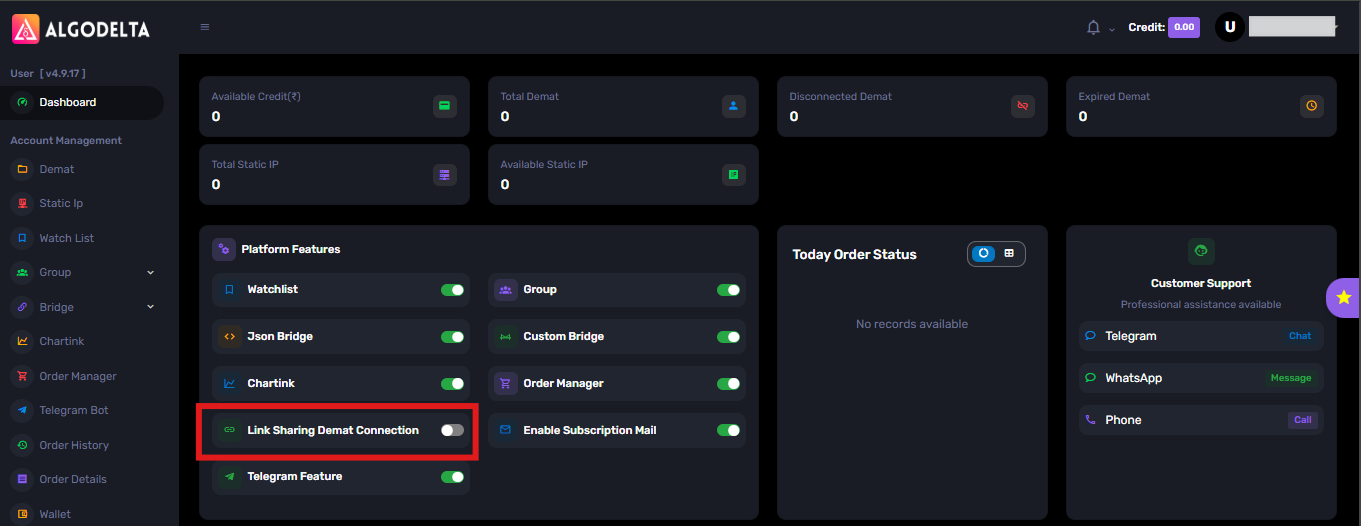
2) Once you enable it, you will see an option like this in the Dashboard tab.
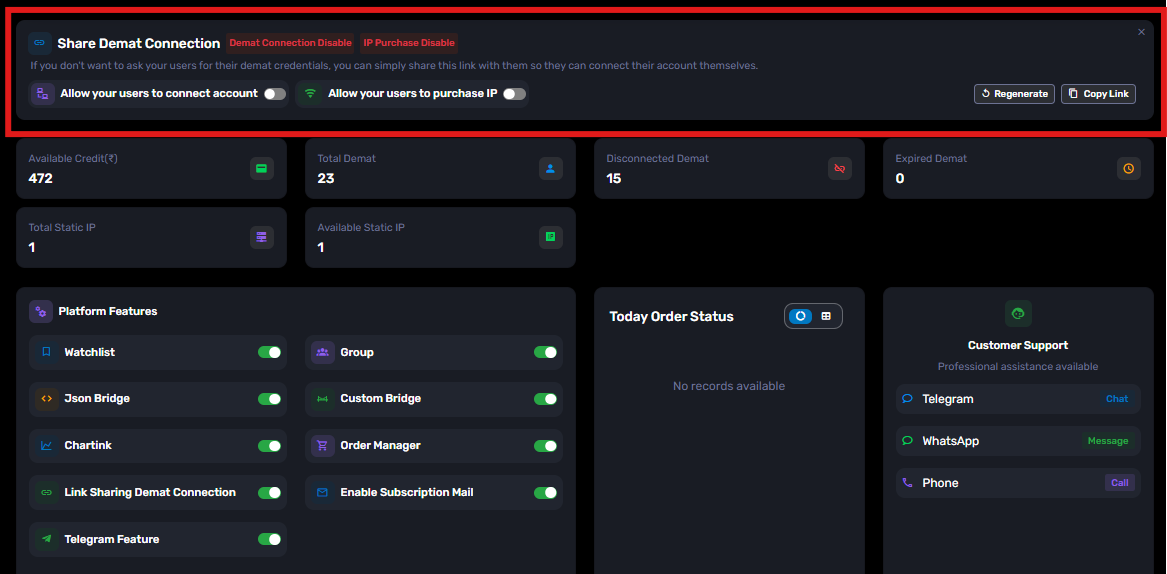
3) Then, you need to enable the “Allow your users to connect account” option.

4) Then, click the “Copy Link” button to copy the link.

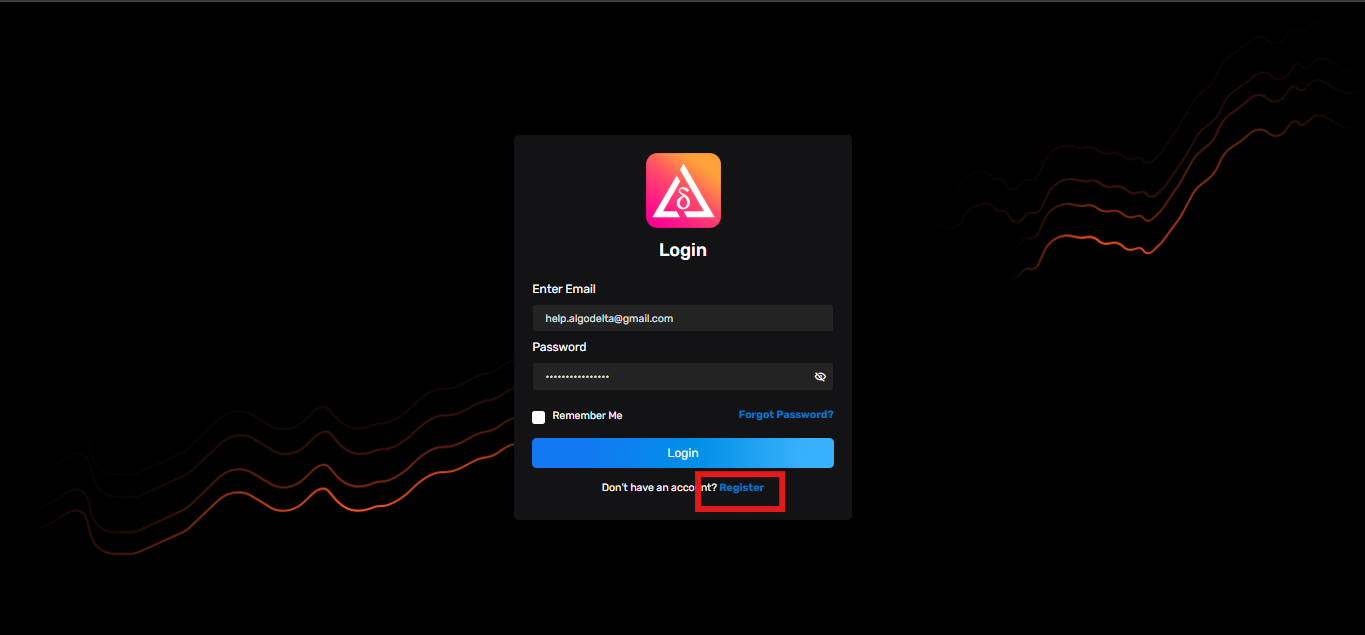
5 ) Then, you need to send this link to your client. The client will see a screen like the one shown below and can register by clicking the “Register” button.
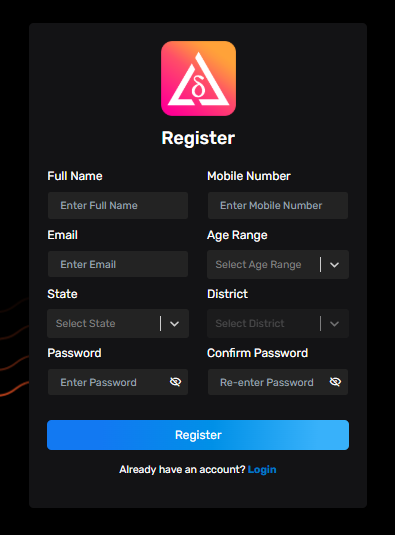
6) After registration, the client will see a screen like the one shown below and can add their broker accounts.
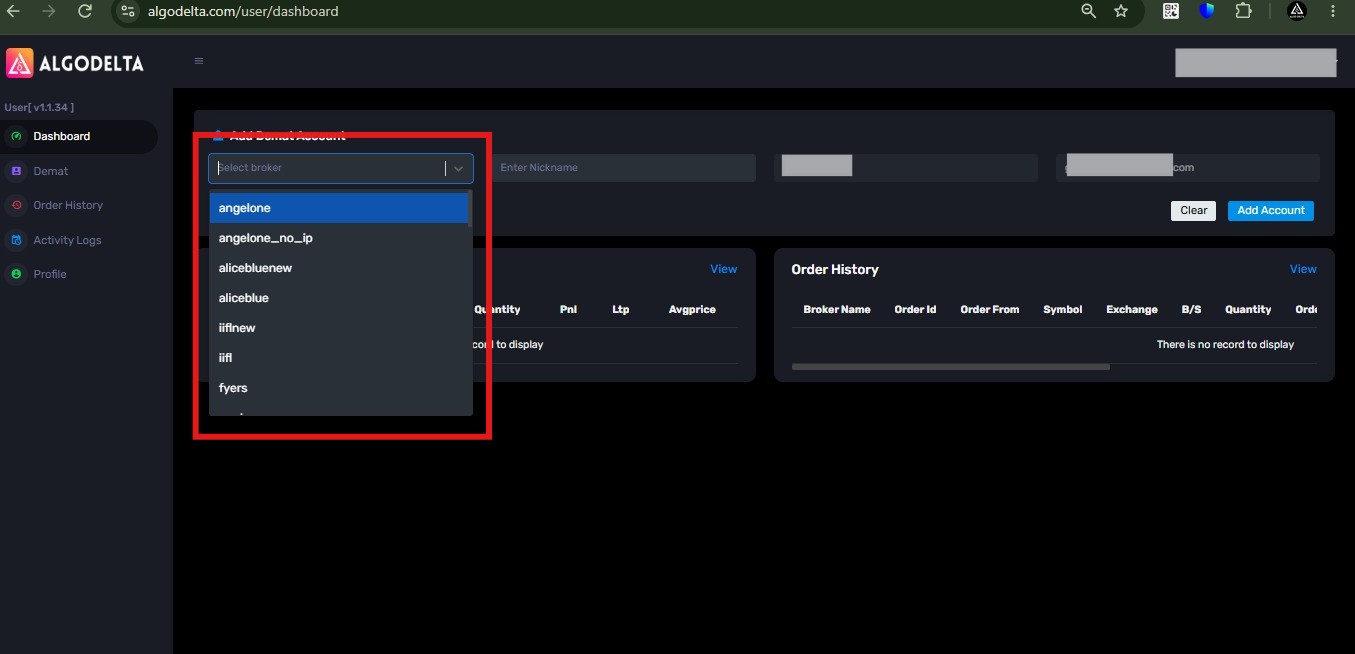
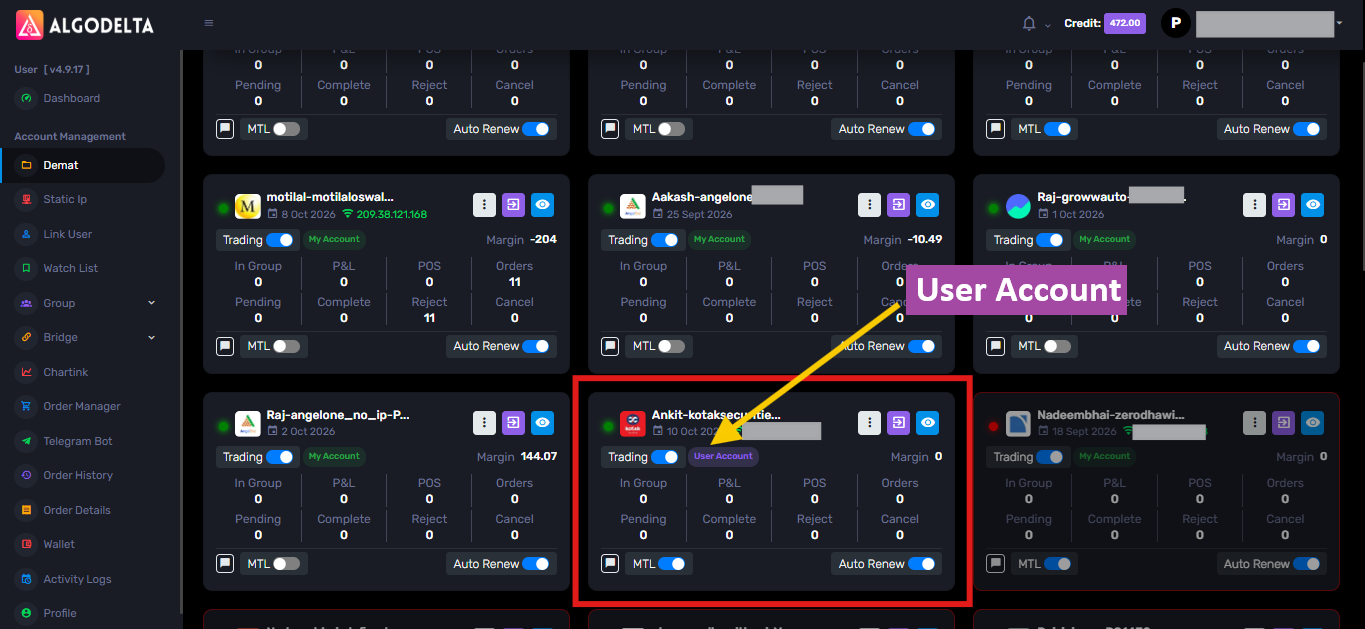
7 ) From the admin side, you can see the client’s account in the Demat tab as a “User Account.” You can then add this account as a child account to Order Manager, TradingView Bridge, Chartink, or any other AlgoDelta feature.
Benefits of “Link Sharing Demat Connection”:
- Clients can add their broker accounts by themselves.
- Clients can view their trades without logging in to their broker terminal.
- Clients can refresh their broker tokens by themselves.
- No need to share broker ID, password, or PIN with the master account.
KeymasterYes sir, you can definitely create your own VWAP using Pine Script’s built-in functions.
Pine Script already provides the ta.vwap() function, so you don’t need to manually calculate the VWAP from price and volume.
You can create it using:
//@version=6
indicator("Custom VWAP", overlay=true)

vwapValue = ta.vwap(close)

plot(vwapValue, "VWAP", color=color.blue)
-> ta.vwap() calculates the VWAP using the selected source.
-> Here, close is used as the source for the VWAP calculation.
-> The result can then be plotted directly on the chart.
You can also make the source configurable:
source = input.source(close, "Source")

vwapValue = ta.vwap(source)

plot(vwapValue, "VWAP", color=color.blue)
=> This approach is useful when you understand the indicator’s logic but want to use Pine Script’s built-in functions instead of manually recreating the entire calculation.
So that’s how you can create your own VWAP using Pine Script’s built-in function.
KeymasterYes sir, you can definitely create a Keltner Channel in Pine Script.
A Keltner Channel generally consists of a middle EMA and upper and lower bands calculated using ATR.
You can create it using:
//@version=6indicator(“Custom Keltner Channel”, overlay=true)`
emaLength = input.int(20, “EMA Length”)
atrLength = input.int(10, “ATR Length”)
multiplier = input.float(2.0, “ATR Multiplier”)middle = ta.ema(close, emaLength)
atrValue = ta.atr(atrLength)upper = middle + atrValue * multiplier
lower = middle – atrValue * multipliermiddlePlot = plot(middle, “Middle”)
upperPlot = plot(upper, “Upper”)
lowerPlot = plot(lower, “Lower”)fill(upperPlot, lowerPlot, color=color.new(color.blue, 90))`
-> The middle line is calculated using EMA.
-> ATR determines the distance of the upper and lower bands.
-> The multiplier controls the width of the channel.
-> The fill() function highlights the area between the two bands.
So that’s how you can create a basic Keltner Channel in Pine Script.
KeymasterYes sir, you can definitely create a Stochastic Oscillator in Pine Script.
The Stochastic Oscillator mainly uses the current close compared with the highest high and lowest low over a selected period.
-> %K measures the current price position within that high-low range.
-> %D is a moving average of the %K line.
You can create a basic version using:
//@version=6
indicator("Custom Stochastic", overlay=false)

kLength = input.int(14, "%K Length")
kSmooth = input.int(3, "%K Smoothing")
dLength = input.int(3, "%D Length")

rawK = ta.stoch(close, high, low, kLength)
k = ta.sma(rawK, kSmooth)
d = ta.sma(k, dLength)

kPlot = plot(k, "%K")
dPlot = plot(d, "%D", color = color.orange)

overbought = hline(80, "Overbought")
MiddLine = hline(50, "Midline")
oversold = hline(20, "Oversold")

fill(overbought, oversold, color=color.new(color.blue, 90))
-> The %K line represents the current price position within the selected high-low range.
-> The %D line is a smoothed version of %K.
-> 80 is commonly used as the overbought level.
-> 20 is commonly used as the oversold level.
-> The input values allow to adjust the calculation from the indicator settings.
=> This gives you a configurable Stochastic Oscillator without depending on the built-in chart indicator.
So that’s how you can create a basic Stochastic Oscillator in Pine Script.
KeymasterYes sir, you can definitely create an ATR indicator in Pine Script.
ATR, or Average True Range, is a volatility indicator that measures the average range of price movement over a selected period.
The True Range considers the current High-Low range as well as the previous candle’s Close.
You can create a basic ATR indicator using:
//@version=6
indicator("Custom ATR", overlay=false)
atrLength = input.int(14, "ATR Length")
trueRange = ta.tr(true)
atrValue = ta.rma(trueRange, atrLength)
plot(atrValue, "ATR", color = color.red)
-> ta.tr(true) calculates the True Range.
-> ta.rma() calculates the moving average of the True Range, which gives us the ATR.
-> The default ATR length is 14, but users can change it from the indicator settings.
=> A higher ATR value generally indicates higher market volatility, while a lower ATR value indicates lower volatility.
So that’s how you can create a basic ATR indicator from scratch in Pine Script.
KeymasterYes sir, you can definitely do that.
Instead of selecting a timeframe or a time range, we can allow the user to enter the exact candle time. The script can then identify that candle, take its High and Low, and calculate the Fibonacci levels from that range.
For example, if the user enters 09:20:
-Candle Time:
09:20=> The 09:20 candle’s High and Low will be used as the Fibonacci range.
You can create it using:
//@version=6
indicator("Candle Fibonacci", overlay=true)

candleHour = input.int(9, "Candle Hour")
candleMinute = input.int(20, "Candle Minute")

newDay = ta.change(time("D")) != 0

var float fib0 = na
var float fib236 = na
var float fib382 = na
var float fib500 = na
var float fib618 = na
var float fib786 = na
var float fib100 = na

if newDay
    fib0 := na
    fib236 := na
    fib382 := na
    fib500 := na
    fib618 := na
    fib786 := na
    fib100 := na

isTargetCandle = hour == candleHour and minute == candleMinute

if isTargetCandle
    rangeHigh = high
    rangeLow = low
    fibRange = rangeHigh - rangeLow

    fib0 := rangeLow
    fib236 := rangeLow + fibRange * 0.236
    fib382 := rangeLow + fibRange * 0.382
    fib500 := rangeLow + fibRange * 0.500
    fib618 := rangeLow + fibRange * 0.618
    fib786 := rangeLow + fibRange * 0.786
    fib100 := rangeHigh

plot(fib0, "0%", color=color.gray)
plot(fib236, "23.6%", color=color.yellow)
plot(fib382, "38.2%", color=color.orange)
plot(fib500, "50%", color=color.blue)
plot(fib618, "61.8%", color=color.green)
plot(fib786, "78.6%", color=color.red)
plot(fib100, "100%", color=color.gray)
-> The user only needs to enter the candle hour and minute.
-> The script identifies that specific candle on the current chart timeframe.
-> The candle’s High and Low become the Fibonacci range.
-> The Fibonacci levels are then plotted for the rest of the day.
=> For example, on a 5-minute chart with the time set to 09:20, the 09:20 candle will be used to calculate the Fibonacci levels.
So that’s how you can create Fibonacci levels from a specific candle in Pine Script.
KeymasterYes sir, you can definitely create a Donchian Channel in Pine Script.
A Donchian Channel is mainly made up of three lines:
-> Upper Band = Highest High over the selected length
-> Lower Band = Lowest Low over the selected length
-> Middle Line = Average of the Upper and Lower BandsYou can create it using:
indicator("Custom Donchian Channel", overlay=true)
length = input.int(20, "Length")
upperBand = ta.highest(high, length)
lowerBand = ta.lowest(low, length)
middleBand = (upperBand + lowerBand) / 2
upperPlot = plot(upperBand, "Upper Band")
lowerPlot = plot(lowerBand, "Lower Band")
plot(middleBand, "Middle Band")
fill(upperPlot, lowerPlot, color = color.new(color.blue, 95))
-> ta.highest() finds the highest high within the selected period.
-> ta.lowest() finds the lowest low within the selected period.
-> The middle line is calculated from the average of the upper and lower bands.
-> fill() highlights the area between the two channel boundaries.
You can change the channel length directly from the indicator settings. The commonly used default is 20 periods.
So that’s how you can create a basic Donchian Channel indicator from scratch in Pine Script.
In one account, you can use multiple strategies, and they will work independently as you mentioned.
You just need to create a separate Bridge for each strategy. For example, if you are using a Custom Bridge, you can create:
- custom_bridge_1 for Strategy 1
- custom_bridge_2 for Strategy 2
The same applies to the JSON Bridge.
If it is still not clear, you can send your query to our support WhatsApp number: 95376 74727.
KeymasterYes, you can connect multiple TradingView strategies to the same account.
You just need to create multiple Bridges and attach the same account to each Bridge.
For more details, you can drop a WhatsApp message on our support number: 95376 74727.
KeymasterYes sir, you can definitely create an RSI indicator in Pine Script.
RSI, or Relative Strength Index, is a momentum indicator that measures the strength of price movements. The commonly used RSI length is 14, with 70 and 30 used as the overbought and oversold reference levels.
You can create it using:
//@version=6
indicator("Custom RSI", overlay=false)

rsiLength = input.int(14, "RSI Length")

rsiValue = ta.rsi(close, rsiLength)

rsiPlot = plot(rsiValue, "RSI")
overbought = hline(70, "Overbought")
oversold = hline(30, "Oversold")
middle = hline(50, "Middle")

fill(overbought, oversold, color=color.new(color.purple, 90))
-> rsiLength controls the RSI calculation period.
-> The ta.rsi() function calculates the RSI value using the selected length.
-> 70 represents the overbought level.
-> 30 represents the oversold level.
-> 50 acts as the middle reference level.
You can change the RSI length directly from the indicator settings without modifying the code.
So that’s how you can create a basic RSI indicator with overbought and oversold levels in Pine Script.
-
AuthorPosts